
Oil Is the Cheapest It’s Been in Years, What’s There to Worry About?
Leslie Evans
The price for a barrel of American-based oil (West Texas Intermediate) this morning was $55.91. The last time it was in this range was in 2009, while in the last three years it had vacillated around $100, a drop of 44%. Regular gas is under $3 a gallon in every state except Alaska and Hawaii. Is this unmitigated good news or is there a downside to the new low prices? And if oil is so plentiful that the price is plunging does this mean we don’t have to worry about peak oil any more?
Why Is the Price Dropping?
At its most basic, what is happening is simple supply and demand. As the chart below shows, except for brief periods in early 2009 and 2012, demand over the last five years, until 2014, was running ahead of supply, pushing the price into the $100 a barrel range. Now, as storage facilities fill up, oil needs to be priced to clear.
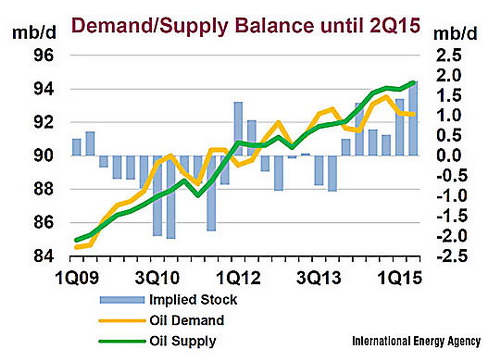
The gap is being caused as much by a fall in demand as by a growth in supply. This is a result of the persistent recession in Europe, a slowdown in the Chinese and German economies, the aftereffects of the 2008 crash in America, where unemployment has since declined but where good paying jobs were replaced by minimum wage and part time work. Improved efficiency is also a factor.
I will come later to the supply side. First the consequences of the price drop.
For consumers, at least in the United States and in countries that import most of their oil, such as Japan, the effects are like a large tax cut, boosting individual consumption. America is saving $400 million a day by the lower prices. The effect is the opposite for many of those who work in the oil industry, and much future investment is put at risk, halting projects that could reduce future oil output by several million barrels a day, promising much higher prices at some point ahead. Kurt Cobb in his Resource Insights blog writes:
“The oil industry was already cutting back its exploration budgets before the price plunge. The industry said that there were not enough profitable prospects available even at $100 per barrel. What happens to industry exploration and development budgets with oil prices now around $60? Without exploration there can be no new production; and without new production, oil supply falls automatically. . . . With existing oil production worldwide declining around 4 to 5 percent per year, the industry already had a huge task keeping production growth just barely positive.” (December 14)
Lower oil prices also make alternative energy less competitive and will retard its adoption, contributing to global warming.
The most hard hit are the petro states, the oil exporters. The Russian economy, which gets 45% of its budget from oil and gas, is in free fall, with the ruble losing 60% of its value and interest rates skyrocketing to 17%. This has been covered extensively in the news because of the international tensions over Putin’s military intervention in eastern Ukraine. Equally hard hit has been Venezuela. Below is a graph of the breakeven prices for the major oil producers and sectors.

At $55 a barrel oil remains profitable for Saudi Arabia, most of the other OPEC states, Russia, and the United States conventional oil producers (excluding shale oil, also called tight oil). But Mexico, Brazil, American shale oil, and Canadian tar sands are serious money losers.
Things are actually worse than these figures suggest. A number of petro states depend directly on oil sales to fund important parts of their national budgets. That requires a much higher price than the mere cost of extraction (see the next chart below).

Saudi Arabia can get oil out of the ground for $24 a barrel, but the large subsidies it provides to its people to keep them quiet require that it sell its oil for $95 a barrel. Major world producers Venezuela, Libya, Iraq, Nigeria, and Iran, all need more than $100 a barrel to fund their budgets, with Iran needing more than $120 a barrel.
At the November 27, 2014, OPEC Summit it was expected that Saudi Arabia, the world’s second-largest producer after Russia, would cut its output to boost prices. It refused to do so, throwing its OPEC partners to the wolves. Iran and Venezuela protested bitterly but were ignored. Here the Saudi’s political concerns came to the fore: by keeping prices low it struck a blow against its regional enemy Iran, and against Russia, which has been backing Iran’s ally, the Assad regime in the Syrian civil war. Iran’s President Ruhani has accused the Saudis of maintaining high production levels as a plot against Iran, while Israeli analysts believe the Saudis are trying to cripple Iranian investment in their nuclear program in the conviction that the U.S. negotiations are too conciliatory and a failure.
Of course, the Saudis also seek to undermine the American shale oil producers, the central source of the growth in world oil supply that is producing the current glut. By its choice the Saudi’s are also selling their oil below the price they need, but they have the largest foreign exchange reserve fund and can afford to spend their capital for a while as their opponents suffer.
Where the Glut Comes From
The price drop gives the impression that there is a global increase in output. That is not the case. The difference between feast and famine comes from a single source: U.S. fracked tight oil.

As the chart above shows, based on data from the federal Energy Information Administration, world oil production today is lower than it was in 2005, the sole exception being the fracked product of American oil plays. Note the steep rate of increase in global output in the first five years of the millennium, followed by the undulating plateau that began in mid-2005, with actual decline over the last three years. The next chart zooms in on the last five years:

The depletion of conventional crude faster than the discovery of new sources, that is, its peaking, has been taking place in the United States just as it has in the rest of the world:

How Secure and Long-Lasting Is Tight Oil?
As the figures on the long-term depletion of conventional oil show, the U.S. has all its eggs in the fracking basket. For several years a blizzard of hyped articles have promoted the idea that the United States is at or on the verge of energy independence. Oil executive Chris Faulkner in the December 16 Los Angeles Times writes that the U.S. “has already overtaken Saudi Arabia, OPEC’s dominant member, as the world’s largest producer of petroleum liquids.” He urges Congress to lift its decades old ban on exporting crude oil to compete with OPEC on the world market.
Numbers change on a weekly basis, but essentially accurate figures for 2014 say that the U.S. produces 8.53 m/bd of crude oil. Russia produces 10, while Saudi Arabia produces about 9.6. The recent decision of the EIA to lump in other “petroleum liquids” is misleading. These are mainly natural gas liquids such as propane, which have a lower energy content than oil and cannot be used as a transportation fuel.
America consumes 18.96 barrels of oil a day. It imports abut 10.5 m/bd. It does not currently export crude oil, but does refine imported crude into gasoline and jet fuel and exports back about 6.5 m/bd of that, making a profit on the refining. This leaves a shortfall of some 4 million barrels a day of crude oil imports consumed here by the American economy. U.S. real home consumption is about 12.5 m/bd and it produces from all domestic sources only 8.5. So we are a very long way from energy independence. Exporting crude now amounts to trying to buy cheap somewhere on the world market and reselling some other country’s oil somewhere where a profit can be made.
Shale, or tight, oil output in 2014 was some 4 m/bd, about 47% of the U.S. total. No one can predict the effect of the drastic global price drop. Mostly that depends on how long it lasts. The big oil companies never got a foothold in the fracking business. It is dominated by fleet-footed small operators. Some are doing very well, while many are deep in debt and hanging on by a thread. David Dayen in the New Republic comments:
“The real unknown is how much domestic oil and gas production has been driven by debt, which could change this from a local to a national problem. Oil producers who financed their investments with borrowed money may not be able to pay back the loans, and default rates are expected to double over the next year.” (December 16)
Shale wells have very different characteristics from conventional ones. In an ordinary well the underground oil forms a liquid pool that can be pumped to the surface. Shale and similar rocks are solid. The oil exists in micropores. It is released by shattering the rock with blasts of high pressure water mixed with toxic chemicals. A conventional well is comparatively cheap to drill and may last for decades, depleting at 4-5% a year. A tight oil well costs around $10 million dollars. The oil is like the water contained in a sponge: most of it comes out in the first squeeze. Hundreds of wells have to be drilled every year just to keep even with the board.
The most definitive survey of the tight oil market is the 300 page Drilling Deeper report (http://www.postcarbon.org/publications/drillingdeeper/) by Canadian energy analyst David Hughes released October 27, 2014. Hughes served for 32 years as a scientist with the Geological Survey of Canada and is currently a fellow at the Post Carbon Institute.
Drilling Deeper in turn draws on the data in the U.S. Energy Information Administration’s Annual Energy Outlook 2014 (http://www.eia.gov/forecasts/aeo/ ), which was released May 7, 2014. What was new in the EIA’s 2014 annual report was individual well time series data for the 12 major plays, which account for 82% of tight oil and 88% of tight natural gas production. Hughes took the EIA raw numbers to calculate decline rates, as well as the difference in output between sweet spots where drilling began and the sharp drop-off as these declined and drilling shifted to the larger, less productive, sections of the active plays.
A good summary is available in Chris Martenson’s December 13 video podcast interview with David Hughes (http://www.peakprosperity.com/podcast/89793/shocking-data-proving-shale-oil-massively-over-hyped ).
“The average three year decline,” Hughes said, “is about 85% in production. The average first year decline is about 70%.” A field like the Bakken in North Dakota is a combination of older wells and those newly drilled. Hughes calculated its annual decline rate at 45%, “which means that 45% of production has to be replaced by more drilling in order to keep production flat.” For the Bakken, 1500 new wells must be drilled every year, at a cost of $15 billion, to keep output flat. Production is growing because they are drilling 2000 wells a year. So next year they will have to drill 2000 wells to replicate this year’s output and then more to increase it.
In late 2014 there were 8,500 producing wells in the Bakken. Hughes estimates that the total capacity of the play is 32,000. The oil companies have been claiming that improved technology is getting more oil from similar wells over time. Hughes confirmed that, tracking a 7% increase in the average well between 2011 and 2013, but said it is hard to differentiate between technological improvement and where the wells were located, as wells in the comparatively small sweet spots produce about twice as much oil before depleting as those in the larger surrounding area. He expects the Bakken sweet spots to run dry in a year or two, after which it would require 3000 new wells to keep level the output that this year was done by 1500. “The technology is never going to make up for bad reservoir rock.” As this would be exceptionally expensive for the return, Hughes foresees drilling in the outlying play strata falling to 1,000 new wells per year with the consequent sharp reduction in output.
The oldest tight oil play is the Barnett in Texas. They drilled 20,000 wells, 4,000 of which have run dry. Production peaked there in 2011 and is now down 17% over its high point. Hughes calculates that the two most productive plays, the Bakken in North Dakota and Montana and the Eagle Ford in Texas, which produce 62% of the country’s shale oil, will peak before 2020, the Bakken in 2015-2016 and Eagle Ford, which is larger, in 2016-2017.
The EIA projects a slower decline rate, running to 2040. David Hughes commented:
“The EIA agrees that the Barnett peaked in 2012 and it is going to decline but then they have a ramp up to nearly the equivalent of the 2012 peak in 2040. So it doesn’t fit with the fundamentals of the play. The only thing I can think of is they have a phenomenal faith in technology.” Hughes’ summary of the last five years is not based on estimates but on the actual output of every tight oil well in the 12 plays.
Confirmation of this pattern of depletion is suggested by the graph below, from the November 22 online Peak Oil Barrel.

Prepared by Ron Patterson from the same EIA data used by David Hughes in Drilling Deeper. The 7 points in the chart are over the government’s drilling permit numbers in the line at the bottom. It tracks 2,171 Bakken wells, grouping and averaging their output by their permit numbers, which are also a time sequence, as the higher numbers were issued later than the lower ones. As the companies did not drill on a rigid schedule there are not the same number of wells in each division. They are ranked by the average amount of oil they produced in their first 24 hours of operation. The earliest wells began at more than 1,200 barrels their first day and peaked at the 24000 permit number set at 1,400, dropping by the 28000 series to a little more than 800 barrels.
Below is the data the chart summarizes, in three columns: the permit numbers on the left, the average first day barrels produced under those permit numbers, and the number of wells in that sample.
Well Numbers B/PD Number of Wells in Sample
18s – 22s 1,235 81
23000s 1,362 134
24000s 1,497 285
25000s 1,320 676
26000s 1,198 591
27000s 1,016 361
28000s 841 40
All indications are that the fracking miracle will be short-lived, while U.S. conventional oil has flatlined since 2005 and is actually declining in the last three years. The tight oil bonanza is real enough while it lasts. It is large enough to throw world production into oversupply in this general climate of economic retrenchment. The bonanza should be used to fund heavy investment in the alternative energy sources we will badly need when the shale oil peters out. Instead it looks like we are on track to pursue business as usual until the day of reckoning pulls us up short.
Comments
Leave a Reply
You must be logged in to post a comment.
Honey on the road to San Francisco with some of the Spanish explorers
NOTES FROM ABOVE GROUND
By Honey van Blossom
 (Honey is a Belgian Marxist former strip-tease artiste)

"Cities of the Golden Gate," Raymond Dabb Yelland, 1893. Most illustrations can be enlarged by clicking on them.
Prologue to the story of the Spanish exploration and settlement of California
Seasonal migrations of animals now extinct in California probably created the roads the native people used before the Spanish land exploration of California. “The heyday of giant mammals in North America was the middle and late Pleistocene, an epoch that started 2.6 million years ago and ended 11,700 years ago, around the time the Earth was thawing out from the Ice Age. The gigantic beasts, which migrated from Asia across a now-vanished land bridge called Beringia, are known as Rancholabrean megafauna, after the famous La Brea tar pits in downtown Los Angeles — the graveyard of thousands of saber-toothed tigers, giant bison and other extinct animals.”[1]
The seasonal migrations of the large mammals may have created the substantial roads used by the indigenous people after their arrival.[2]
Paul S. Martin and Richard G. Klein argue that Paleoindian over-hunting led to the extinction of the megafauna.[3] Others argue that climate change was responsible for mammoth and mastodon extinctions. As the last major glaciation ended around 12,000 years ago, climate warmed too quickly for the megafauna to adapt.

